Data Adapters specify the kind of data used within a dashboard. Once the Data Adapter is configured and pointing to the appropriate data, attach it to a Dashboard component in order to display it on a dashboard.
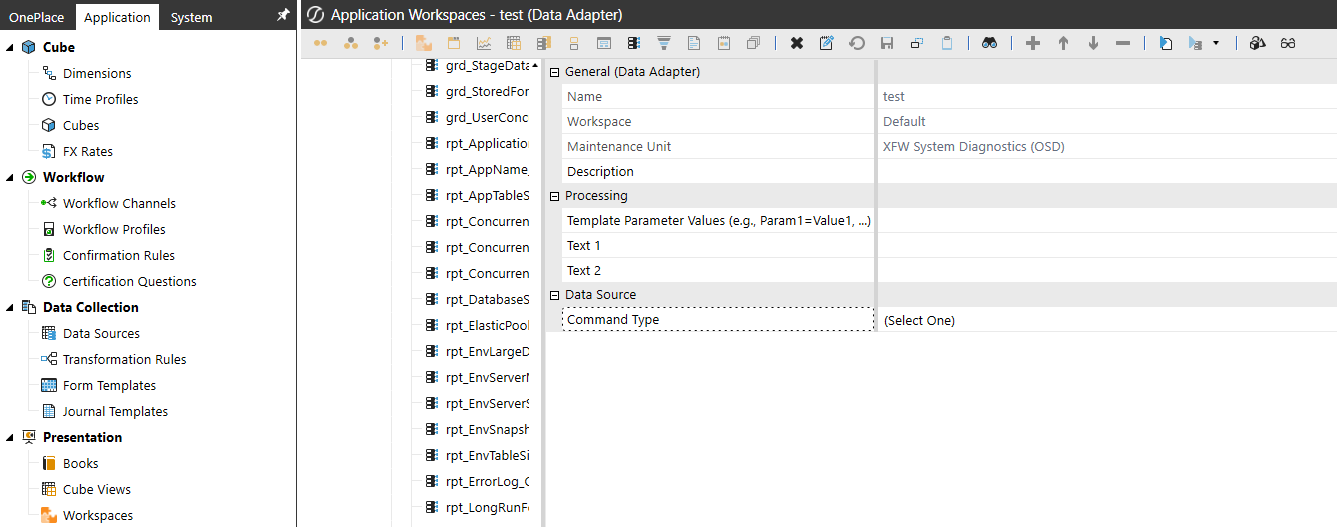
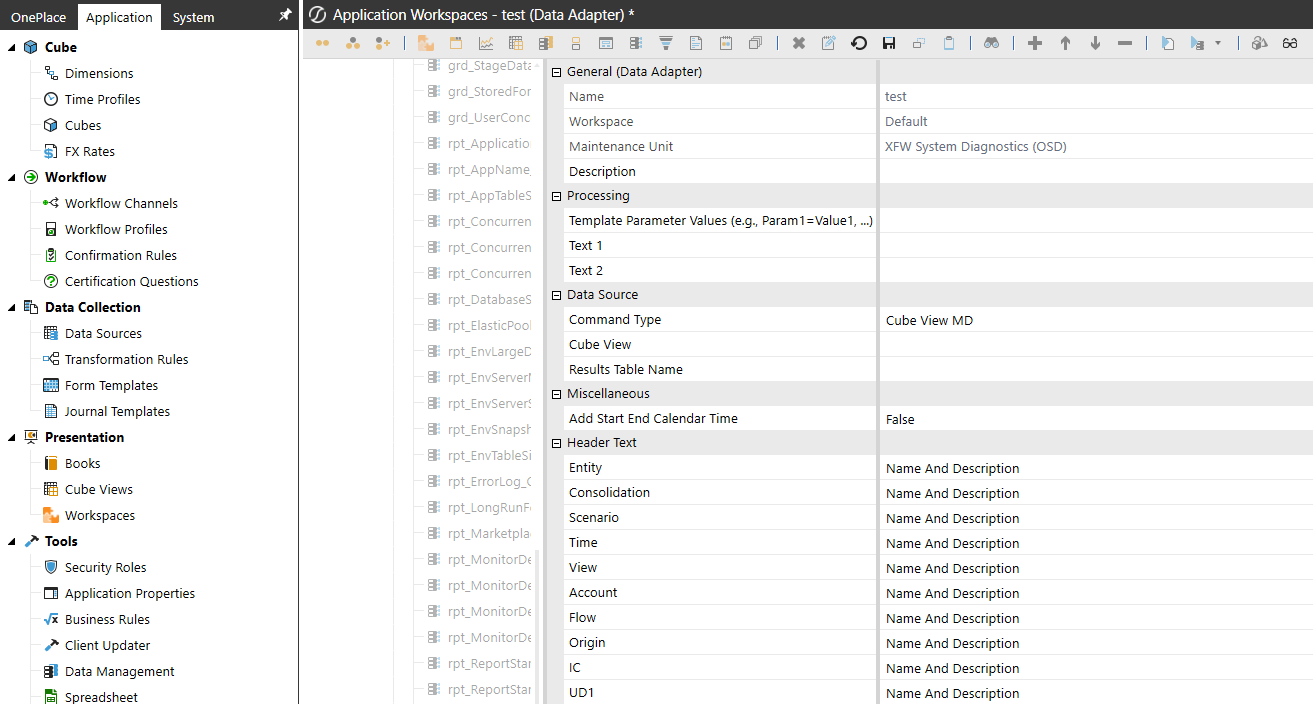
To create and view Data Adapters, go to Application >Presentation >Workspaces > [choose Workspace] >[choose Maintenance Unit] >Data Adapters.
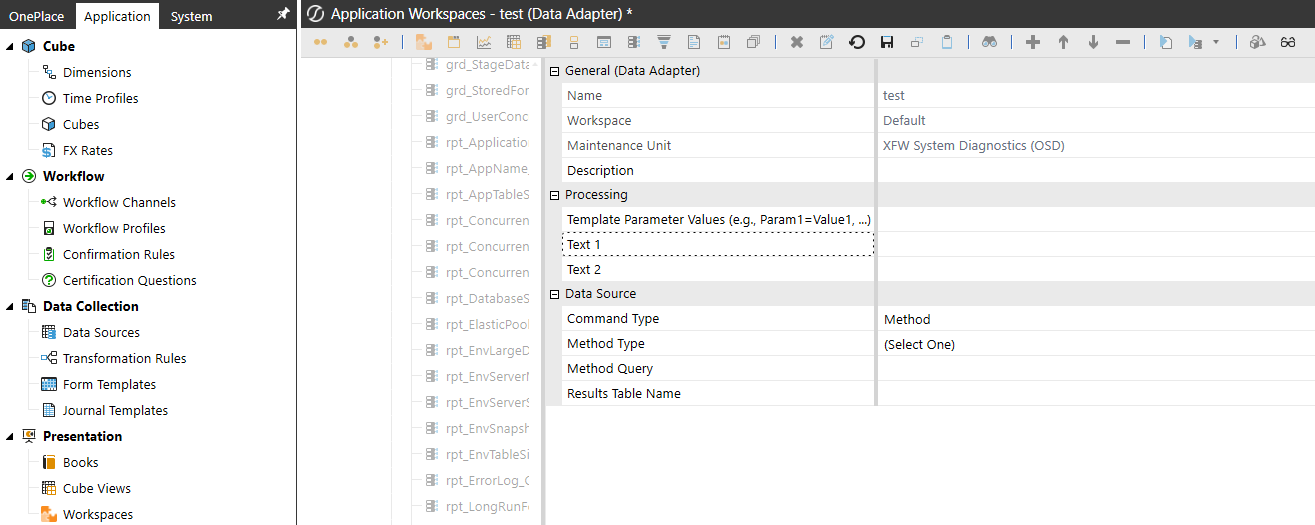
The Data Adapter provides General (Data Adapter), Processing, and Data Source sections for configuration. Depending on the selected Data Source, additional options may be displayed.
Create a Data Adapter
To create a Data Adapter:
-
Select
 New Data Adapter.
 -
Enter the required data in the General and Processing sections.
-
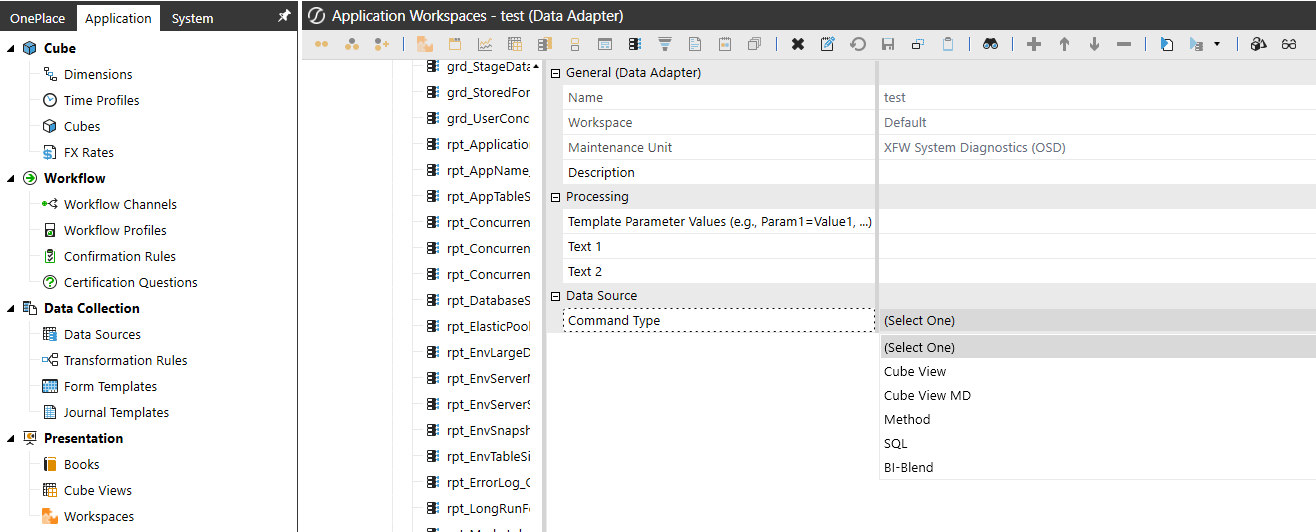
In the Data Source > Command Type drop-down menu, select Cube View, Cube View MD, Method, SQL, or BI-Blend.
-
To configure the Data Adapter, see Command Types
General (Data Adapter) Properties
These properties are available:
-
Name: The name of the Data Adapter.
-
Maintenance Unit: The Maintenance Unit to which the Data Adapter belongs.
-
Description: A description of the Data Adapter.
Command Types
These Command Types are available:
Cube View Command Type
To use a Cube View as the Data Adapter source to return a Reporting Table, select Cube View.
NOTE: To return a multi-dimensional fact table, use the Cube View MD command type.
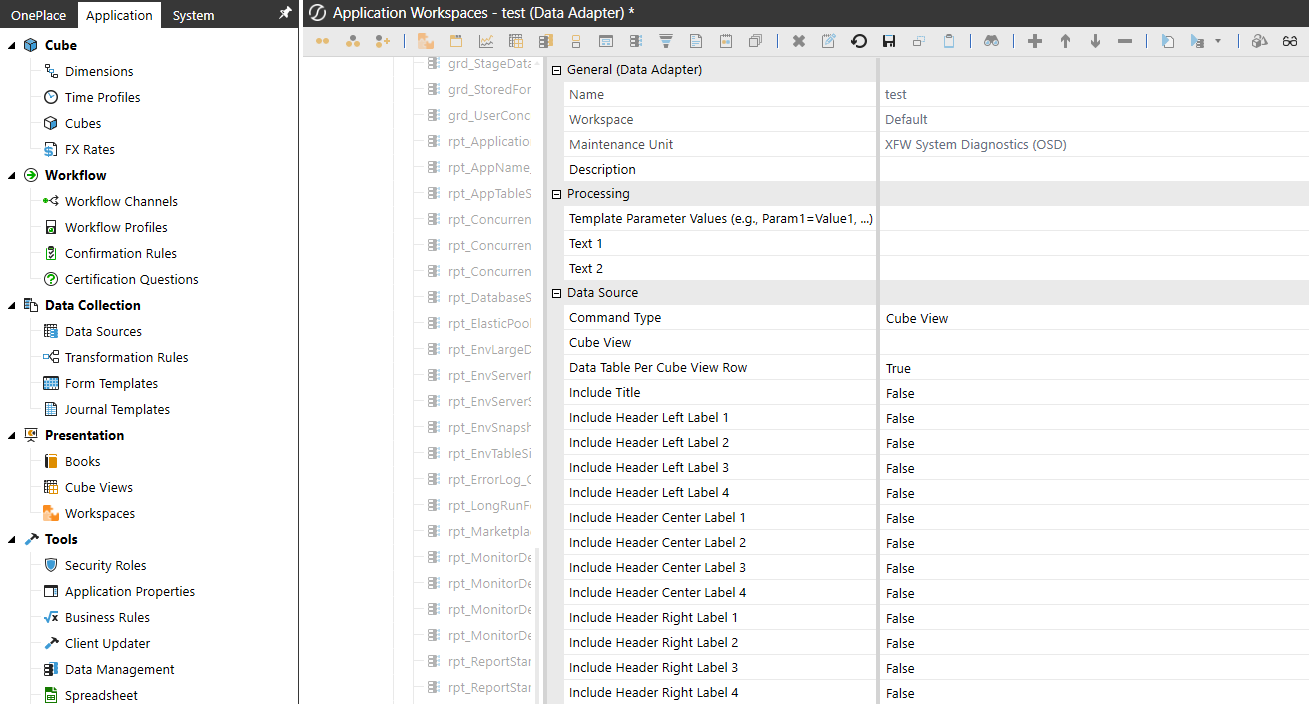
Additional options can be selected here to include supplemental information for the resulting table.
NOTE: Adding information that is beyond the default options may have a slight impact on performance:
-
Cube View: This command type allows for a pre-configured Cube View to be the Data Source for a dashboard. Click
 and begin typing the name of the Cube View in the blank field. As the first few letters are typed, the names are filtered making it easier to find and select the one desired. If the name is unknown, expand a Cube View Group and scroll through the list to select the correct one. Once the Cube View is selected, click CTRL and Double Click. This will enter the correct name into the appropriate field.
 -
Data Table Per Cube View Row: At the creation of the Data Adapter, the default is set to True. When set to True, a Data Table is created for each row in the dashboard. This allows for conditional formatting per Cube View row. Set this to False in order to merge the rows into one table. This will omit any undefined Cube View row.
-
Include Title: At the creation of the Data Adapter, the default is set to False. When set to True, the title will be displayed from the Report section of the Cube View as the title for the dashboard. Settings are True or False.
-
Include Header Left Label 1-4: At the creation of the Data Adapter, the default is set to False. When set to True, the left header labels will be displayed from the report section of the Cube View for the dashboard.
-
Include Header Center Label 1-4: At the creation of the Data Adapter, the default is set to False. When set to True, the center header labels will be displayed from the report section of the Cube View for the dashboard.
-
Include Header Right Label 1-4: At creation of the Data Adapter, the default is set to False. When set to True, the right header labels will be displayed from the report section of the Cube View for the dashboard.
-
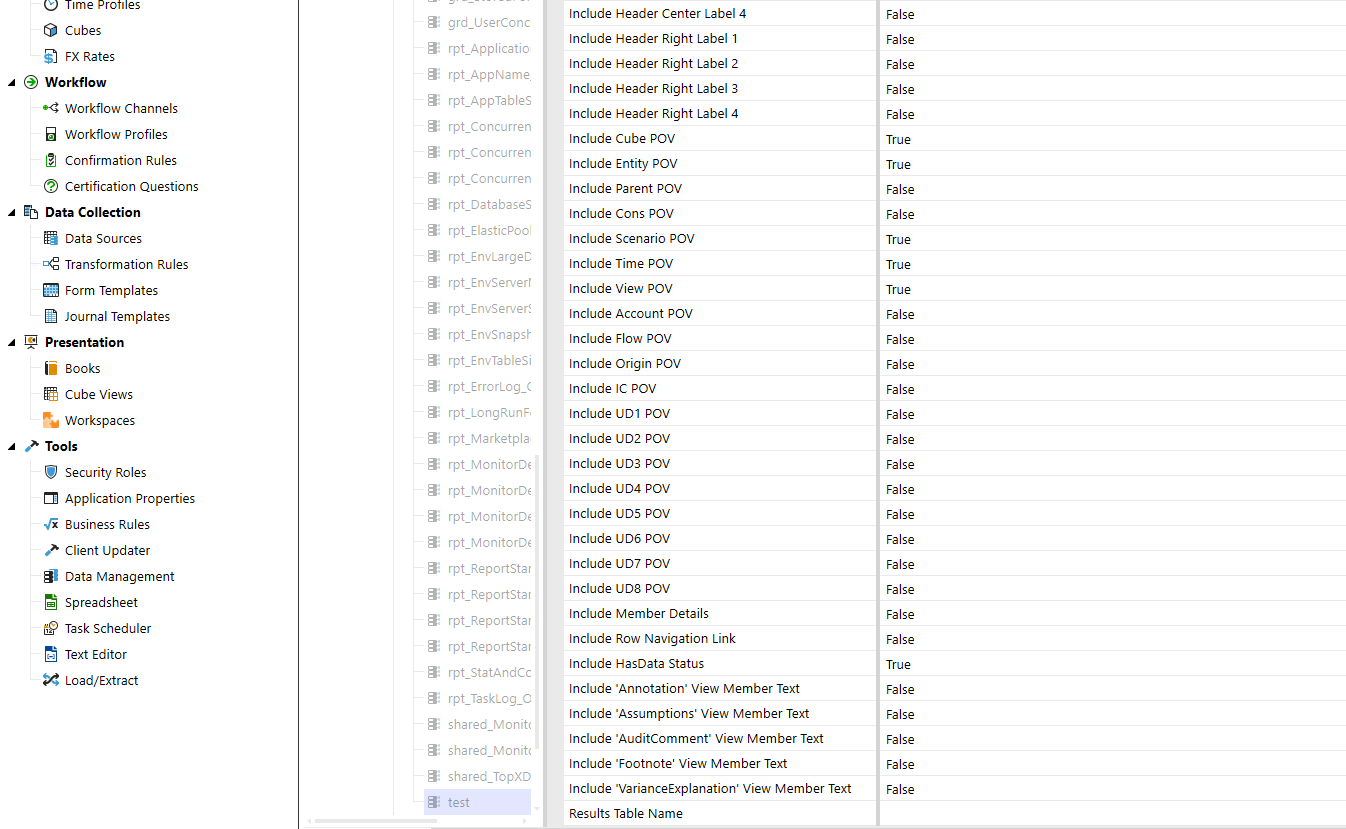
Include… POV: If set to True, the POV information for the Cube, Entity and all other Dimensions are included. Use these if the report or dashboard needs this information.
-
Include Member Details: If set to True, additional Member property details are included in the results.
-
Include Row Navigation Link: If set to True, this data Adapter will include a row navigation link from a Cube View.
-
Include HasData Status: Includes additional true/false data on whether the row of results contains data for filtering purposes. Settings are True or False.
-
Include … View Member Text: This determines whether different Data Attachment text is going to be part of the results. This is necessary for showing text in a Data Explorer object or for using a Waterfall Chart and wanting to optionally show comments. Settings are True or False.
-
Results Table Name: This specifies the name of the resulting table generated when the Data Adapter is run, otherwise it will default with a name of Table.
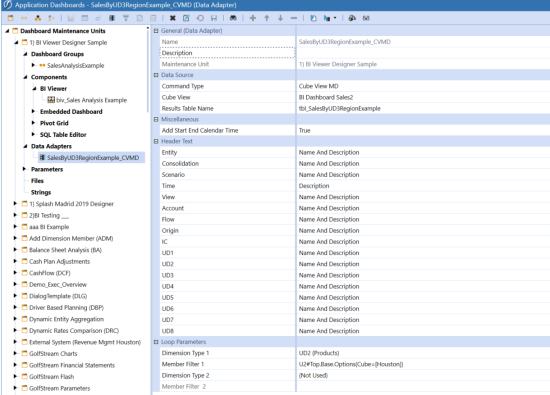
Cube View MD (Multi-Dimensional) Command Type
To use a Cube View as the Data Adapter source to return a Multi-Dimensional Fact Table, select Cube View MD. The results of the Cube View MD are Dimensions (Entity, Consolidation, Scenario, time, View, Account, Flow, Origin, IC, UD1-UD8) as columns. This simplifies the report building process in the BI Designer, Pivot Grid, and dashboard development.
Loop Parameter options are available that can be selected to include incremental information from the modified Cube View definition in the resulting table.
NOTE: To return a reporting table, use the Cube View command type.
Additional options can be selected here to include supplemental information for the resulting tables.
NOTE: Adding information that is beyond the default options may have a slight impact on performance:
-
Cube View: This command type allows for a pre-configured Cube View to be the Data Source for a dashboard. Click
and begin typing the name of the Cube View in the blank field. As the first few letters are typed, the names are filtered making it easier to find and select the one desired. If the name is unknown, expand a Cube View Group and scroll through the list to select the correct one. Once the Cube View is selected, click CTRL and Double Click. This will enter the correct name into the appropriate field. -
Results Table Name: The name of the table that is generated when the Data Adapter runs. The default name is Table. Enter a descriptive name that can be used to identify the content of the table and the associated Data Adapter.
For example; tbl_OperatingExpenses can be used to identify the Results Table Name and the Name of the Data Adapter (OperatingExpenses_CVMD in this example) associated with this table.
-
Add Start End Calendar Time: When set to True, the Data Table incorporates the Start and End Date used in the POV / Time Profile for the Cube View and creates two additional columns in a Date/Time Field Type Format; StartDate, EndDate for each row in the dashboard. This allows for the ability to utilize the Date Grouping functions in the BI Designer. Set this to False to not add or display these Date Time fields.
-
Entity: Controls the display of the Entity Name and Description in the results table from the Cube View. Select Name and Description (default), Name, or Description to show the name and description, only the name, or only the description.
-
Consolidation: Controls the display of the Consolidation Name and Description in the results table from the Cube View. Select Name and Description (default), Name, or Description to show the name and description, only the name, or only the description.
-
Scenario: Controls the display of Scenario Name and Description in the results table from the Cube View. Select Name and Description (default), Name, or Description to show the name and description, only the name, or only the description.
-
Time: Controls the display of the Time Name and Description in the results table from the Cube View. Select Name and Description (default), Name, or Description to show the name and description, only the name, or only the description.
-
View: Controls the display of the View Name and Description in the results table from the Cube View. Select Name and Description (default), Name, or Description to show the name and description, only the name, or only the description.
-
Account: Controls the display of the Account Name and Description in the results table from the Cube View. Select Name and Description (default), Name, or Description to show the name and description, only the name, or only the description.
-
Flow: Controls the display of the Flow Name and Description in the results table from the Cube View. Select Name and Description (default), Name, or Description to show the name and description, only the name, or only the description.
-
Origin: Controls the display of the Origin Name and Description in the results table from the Cube View. Select Name and Description (default), Name, or Description to show the name and description, only the name, or only the description.
-
IC: Controls the display of the IC Name and Description in the results table from the Cube View. Select Name and Description (default), Name, or Description to show the name and description, only the name, or only the description.
-
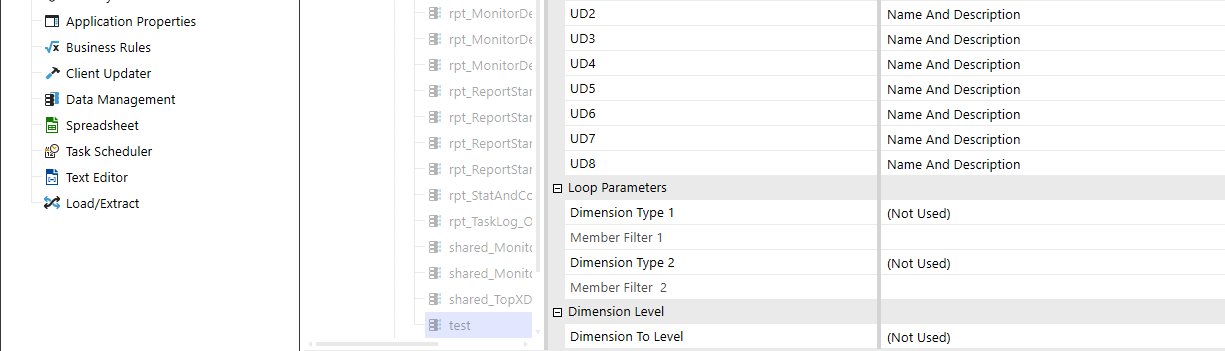
UD1-UD8: Controls the display of the UD1-UD8 Name and Description in the results table from the Cube View. Select Name and Description (default), Name, or Description to show the name and description, only the name, or only the description.
Loop Parameters
This section allows changes to be made to the output of a Cube View definition being used in a table for reporting. The Loop Parameter filters the results and considers the additional parameters to be passed to the Cube View definition and add those results to the table accordingly.
The parameter(s) overrides the POV. So, if the Entity POV is set to CT, and the loop filter parameters are set to NY, MA, and NJ, then data for those will be returned and NOT CT. A Loop must be used in order to change parameters.
For example, a Loop Parameter may be used to loop through a list of Entities in the Cube View definition and return multiple Entities for that specific Cube View. The Dimension Type and Member Filters should be added here to pass along the appropriate Loop (e.g. Dimension Type=Entity, Member Filter= E#US.Base) which applies to each Entity included in the Loop.
NOTE: It is recommended to not loop on any Dimensions that already exist in the Cube View’s rows or columns.
At the creation of the Data Adapter, the default for each Dimension Type (1 & 2) are set to (Not Used) and Member Filter (1&2) are greyed out. This will display the results without any consideration of additional parameters to pass to the query. When the Dimension Types are set along with the Member Filters, the results will consider the additional parameters to be passed to the Cube View definition and add those results to the table accordingly.
-
Dimension Type 1: The Dimension Type containing the list of Members. e.g., Entity or Account
At the creation of the Data Adapter, the default for each Dimension Type (1 & 2) are set to (Not Used) and Member Filter (1&2) are greyed out. This will display the results without any consideration of additional parameters to pass to the query. When the Dimension Types are set along with the Member Filters, the results will consider the additional parameters to be passed to the Cube View definition and add those results to the table accordingly.
-
Member Filter 1: Enter a Member Filter here to determine what is seen in the Parameter.
At the creation of the Data Adapter, the default for each Dimension Type 1 is set to (Not Used) and Member Filter 1 is greyed out. This will display the results without any consideration of additional parameters to pass to the query. When the Dimension Types are set along with the Member Filters, the results will consider the additional parameters to be passed to the Cube View definition and add those results to the table accordingly.
The name of the Dimension containing the list of Members. Start typing in the blank field OR click the ellipsis button
 in order to launch the Member Script Builder and enter a Member Script to change the Cube View definition. The example below is changing the POV for the Products.
Example: UD2; U2#Top.Base -
Dimension Type 2: At the creation of the Data Adapter, the default for Dimension Type 2 is set to (Not Used) and Member Filter 2 is greyed out. This will display the results without any consideration of additional parameters to pass to the query. When the Dimension Types are set along with the Member Filters, the results will consider the additional parameters to be passed to the Cube View definition and add those results to the table accordingly.
-
Member Filter 2: Enter a Member Filter here to determine what is seen in the Parameter.
At the creation of the Data Adapter, the default for Dimension Type 2 is set to (Not Used) and Member Filter 2 is greyed out. This will display the results without any consideration of additional parameters to pass to the query. When the Dimension Types are set along with the Member Filters, the results will consider the additional parameters to be passed to the Cube View definition and add those results to the table accordingly.
The name of the Dimension containing the list of Members. Start typing in the blank field OR click the ellipsis button
in order to launch the Member Script Builder and enter a Member Script to change the Cube View definition. The example below is changing the POV for the Products.
Example: UD2; U2#Top.Base
Dimension Leveling
The Dimension Level property setting in the Cube View MD Data Adapter displays dimensional data as a hierarchical tree in the BI Viewer. Dimension leveling allows you to display data in a hierarchical structure into which you can drill down to view child data. After the data is leveled, you can use the BI Viewer to view data as a tree, a pivot table, a chart, or a grid.
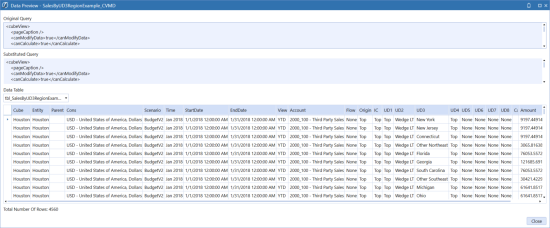
Cube View MD Data Adapter Example
Results Table from the Cube View MD Data Adapter example above.
Prerequisites
To use dimension leveling to display hierarchical data, you must first create a cube view MD data adapter with data.
Create the Data Adapter
Cube View MD Data adapters allow you to pull data from a Cube View. To create a data adapter:
- Inside the OneStream application, click the Application Dashboards tab at the bottom of the screen.
- Expand the appropriate Dashboard Maintenance Unit.
- Click the Data Adapter label.
- Click the Create Data Adapter button on the toolbar.
- In the Name field, type the name of the data adapter.
- In the Command Type field, click the drop-down arrow and select Cube View MD.
- Click the Edit button ()at the far right of the Cube View field.
- In the Object Lookup dialog box, select the appropriate Cube View and then click OK.
- In the Dimension to Level field, click the drop-down arrow and select the appropriate leveling option. With this step, you are leveling on this dimension, which in this case is Entity.
- Select one of the following:
- Outermost Row - hierarchy uses the first row and first level (of row) definition.
- Outermost Column - hierarchy uses the first column and first level (of column) definition.
- Both - hierarchy uses the first row and first level definition and uses the first column and first level (of column) definition.
NOTE: When Data Adapter is run, the Data Table will generate the additional columns for the levels including a column(s) to determine the status of the level:
RowMemberIsBase = 1: Row Member contains the Base level of data RowMemberIsBase = 0: Row Member is not the Base level of data ColumnMemberIsBase= 1: Column Member contains the Base level of data ColumnMemberIsBase= 0: Column Member is not the Base level of data
- Click Save.
- Test the data adapter by clicking Test Data Adapter. The Data Preview dialog box displays the table data.
-
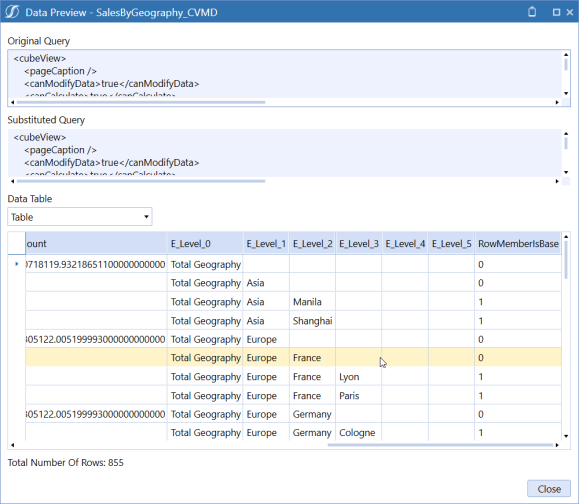
NOTE: When Data Adapter runs, the Data Table generates the additional columns for the levels including columns to determine the status of the level.
Each dimension leveled column is prefixed with an E to indicate it is an Entity, followed by a level number. A RowMemberIsBase value of 1 indicates that there is no remaining child data.
- Click Close.
View Results in the BI Viewer
You can view data in various ways using the BI Viewer. For example, you can configure the BI Viewer to display data in pivot tables and charts at the same time. To configure the BI Viewer:
- Click the Application Dashboard tab at the bottom of the window.
- Create a BI Viewer component:
- Click the Components label in the tree.
- Click the Create Dashboard Component button on the toolbar.
- In the Create Dashboard Component dialog box, click BI Viewer and then click OK
- On the Component Properties tab, in the Name field, type the name of the new component.
- Click the Data Adapters tab at the top of the window.
- Click the Add Dashboard Component button on the toolbar.
- In the Add Data Adapter dialog box, select the appropriate data adapter and then click OK.
- Click Save.
- Design the BI Viewer dashboard:
- Click the BI Designer tab at the top of the window.
- In the Data Source field, click the drop-down arrow and select the data source from which to pull data. This is usually a table.
- Drag each dimension level that you want to view from the Table view into the Data Items column under Dimensions.
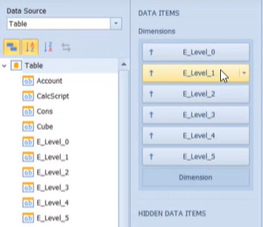
If you want to filter items based on whether they are base items, drag the RowNumberIsBase item into the Data Items column but under Hidden Data Items. This item will not display in the resulting dashboard but will be available for you to filter on if necessary.
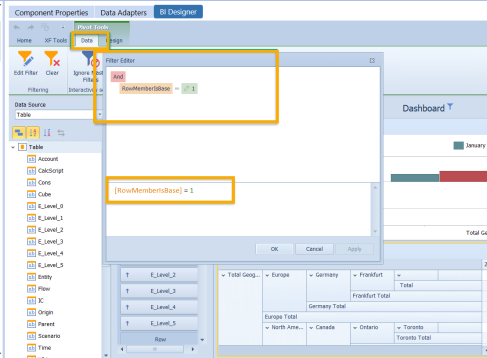
From the BI Designer ribbon, select the type of dashboard item you want to view in the dashboard. For example, select Filter Element > Tree View. In the resulting tree view in the dashboard notice that you can expand parent members down to their base child members.
If you add a Grid, all levels of the parent entity display in their own columns. If you want to see a pivot table, select Pivot from the ribbon and notice that each level is expandable similar to tree view.
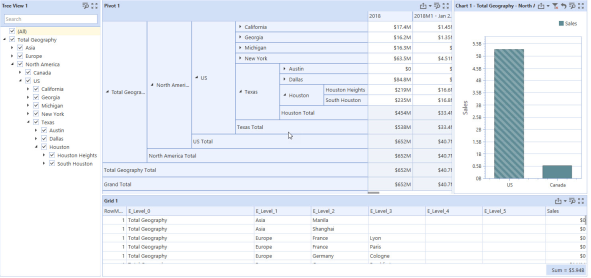
Conclusion
With Dimension leveling, you can view data in an easy-to-understand, hierarchical format. With the BI Viewer, you can design various dashboard items in which to view the dimension leveled data.
Method Command Type
To use a Method as the Data Adapter source to return a table, select Method and then select a Method Type.
TIP: To view an example Method Query, leave the Method Query field blank, click Save, and then click Test Data Adapter  .
.
Method Types
BusinessRule
Use the Business Rule method when creating a custom rule to incorporate within a Method Query. The Business Rule is used as the first set of {} within the Method Query.
Example Method Query:
{XFR_DataUnitCompare}{DataUnitComparisonDataSet}{Cube1=|!Members_Cubes!|, Entity1=|!Members_Entities_AllDims_Base!|,
Parent1=[], Cons1=|!Members_Cons_Statutory!|,Scenario1=|!Members_Scenarios_AllDims_Base!|, Time1=|!Members_Time_WFYear_
Base!|, Cube2=|!Members_Cubes!|, Entity2=|!Members_Entities_AllDims_Base!|,
Parent2=[], Cons2=|!Members_Cons_Statutory!|, Scenario2=|!Members_Scenarios_
AllDims_Base_Var!|, Time2=|!Members_Time_WFYear_Base!|, View=
|!Members_View_Numeric!|, SuppressMatches=|!DataUnit_SuppressMatches!|}{MyBusinessRuleName}{MyDataSetName}{Name1=Value1, Name2=[Value2]}CertificationforWorkflowUnit
The CertificationforWorkflowUnit method lists all Certification Questions for the particular Workflow Unit. Parameters should include the following, each enclosed in curly braces:
Example Method Query:
{MyWorkflowProfileName}{Actual}{2015M1}{true}{Empty String or Filter Expression}{Dallas}{Actual}{2011M2}{true}{}ConfirmationforWorkflowUnit
The ConfirmationforWorkflowUnit method lists the Confirmation Rules results for a particular Workflow Unit. Parameters should include the following, each enclosed in curly braces:
Example Method Query:
{MyWorkflowProfileName}{Actual}{2015M1}{true}{Empty String or Filter Expression}{Montreal}{Actual}{2011M6}{true}{}DataUnit
The DataUnit method returns all rows of data related to the specified Data Unit (i.e. Cube, Entity, Parent, Consolidation Member, Scenario, Time and View). Parameters should include the following, each enclosed in curly braces:
Example Method Query:
{Cube}{Entity}{Parent}{Cons}{Scenario}{Time}{View}{True}{Empty String or Filter Expression}DataUnitComparison
This returns all rows from two different Data Units specified for comparison purposes. Parameters should include the following, each enclosed in curly braces:
Example Method Query:
{Cube1}{Entity1}{Parent1}{Cons1}{Scenario1}{Time1}{Cube2}{Entity2}{Parent2}{Cons2}{Scenario2}{Time2}{View}{True}{True}{Empty String or Filter Expression}ExcelFile
The ExcelFile method returns data sourced from an Excel file. Parameters should include the following, each enclosed in curly braces:
Example Method Query:
{Application}{Documents/Public/MyExcelfile.xfDoc.xlsx}{Sheet1 or Empty}
{MyDataRange or Empty}{False}{False}{}
FormsStatusForWorkflowUnit
The FormsStatusForWorkflowUnit method lists detailed information about the Forms for a particular Workflow Unit. Parameters should include the following, each enclosed in curly braces:
Example Method Query:
{Houston}{Actual}{2011M1}{All}{}{MyWorkflowProfileName}{Actual}{2015M1}{All}{Empty String or Filter Expression}Groups
The Groups method returns the Group ID, Name, Description and whether or not this is an Exclusion Group. Parameters should include the following, each enclosed in curly braces:
For example:
{GroupName = 'FinanceGroup'}GroupsforUsers
The GroupsforUsers method returns the Select User properties and all of the Groups to which the user. This returns the same group properties as the Group Method Query. Parameters should include the following, each enclosed in curly braces:
Example Method Query:
{UserName = 'Administrator'}{}ICMatchingforWorkflowUnit
The ICMatchingforWorkflowUnit method returns a detailed Intercompany Matching Report table for the given Workflow Unit and several other Parameters. The Parameters override what is set up in the Workflow Profile. Parameters should include the following, each enclosed in curly braces:
Example Method Query:
{Workflow Profile Name}{Scenario Name}{Time Name}{Plug Account Override}{
Suppress Matches Override}{Tolerance Override}{Filter}{Flint}{Actual}{2011M1}{Empty String or A#MyPlugAccount}{Empty String or
true/false}{Empty String or 0.0}{Empty String or Filter Expression}.{MyWorkflowProfileName}{Actual}{2015M1}{PlugAccount for Workflow Parameter Set (Exclude A#)}{Empty String or C#MyCurrencyOverride}{Empty String or V#MyViewOverride}{Empty String or A#MyPlugAccountOverride}{Empty String or true/false}{Empty String or 0.0}{Empty String or E#MyEntityOverride}{Empty String or E#MyPartnerOverride}{Empty String or MyDetailDimsOverride (F#All:O#Top:U1#All:U2#All:U3#All:U4#All:U5#All:U6#All:U7#All:U8#All)}{Empty String or Filter Expression}ICMatchingPlugAccountsforWorkflowUnit
The ICMatchingPlugAccountsforWorkflowUnit method returns the list of Intercompany Plug Accounts for a given Workflow Profile and Scenario Type configured for the Workflow Profile. Parameters should include the following, each enclosed in curly braces:
Example Method Query:
{MyWorkflowProfileName}{Actual}{2015M1}JournalforWorkflowUnit
Th JournalforWorkflowUnit method lists the Journals entered for a given Workflow Unit. Parameters should include the following, each enclosed in curly braces:
{Frankfurt}{Actual}{2011M3}{All}{}{MyWorkflowProfileName}{Actual}{2015M1}{All}{Empty String or Filter Expression}Members
The Members method returns Dimension ID, Member information such as ID, Name and Description, and a few other properties for the chosen Dimension and Member Filter. Parameters should include the following, each enclosed in curly braces:
{Account}{MyAccountDim}{A#Root.TreeDescendants}{Empty String or Filter Expression}UserCubeSliceRights
The UserCubeSliceRights method lists each user’s Data Access settings on a given Cube. Parameters should include the following, each enclosed in curly braces:
Example Method Query:
{AllUsers}{AllCubes}{Empty String or Filter Expression}UserEntityRights
The UserEntityRights method returns the Cubes and Entities the user has access to according to the security settings under Entities. Parameters should include the following, each enclosed in curly braces:
Example Method Query:
{AllUsers}{AllCubes}{AllEntities}{Empty String or Filter Expression}Users
The Users method returns all properties associated for the chosen User Name. Parameters should include the following, each enclosed in curly braces:
Example Method Query:
{UserName = 'Administrator'}UserScenarioRights
The UserScenarioRights method returns all accessible Scenarios and many related Scenario properties for the chosen User Name filter and Cube. Parameters should include the following, each enclosed in curly braces:
Example Method Query:
{AllUsers}{AllCubes}{Empty String or Filter Expression}UserinGroups
The UserinGroups method returns a list of Users and selected User properties for the chosen User Group. Parameters should include the following, each enclosed in curly braces:
Example Method Query:
{GroupName = 'FinanceGroup'}{}UserWorkflowProfileRights
The UserWorkflowProfileRights method lists the rights assigned to users for Workflow Profiles. Parameters should include the following, each enclosed in curly braces:
Example Method Query:
{User Name}{Workflow Cube Name}{Workflow Profile Type}{Filter}{Administrator}{GolfStream}{AllProfiles}{}{AllUsers}{AllProfiles}{AllProfiles}{Empty String or Filter Expression}WorkflowandEntityStatus
The WorkflowandEntityStatus method returns properties for Workflow status, status code/description, last executed step, date/time information, completed steps, and data status for the chosen Workflow Unit including both the Workflow Profile level and individual Entity level.
Workflow Profile Description is a clear, human‑readable description of the workflow profile that better communicates its purpose and scope. Last Step User is the person who most recently completed a workflow step and it provides visibility into who last acted on that workflow.
Parameters should include the following, each enclosed in curly braces:
Example Method Query:
{MyWorkflowProfileName}{Actual}{2015M1}{AllProfiles}{Descendants}{Empty String or Filter Expression}WorkflowCalculationEntities
This lists the Entities that appear under Calculation Definitions for this Workflow Profile. Parameters should include the following, each enclosed in curly braces:
WorkflowConfirmationEntites
This lists the Entities that appear under Calculation Definitions with a Confirmed check box for this Workflow Profile. Parameters should include the following, each enclosed in curly braces:
WorkflowLockHistory
The WorkflowLockHistory method displays all Lock history details in a report for a given Workflow Profile with the ability to filter by Scenario, Time, Workflow Profile, Origin, Channel, Time, User and Lock Status. Parameters should include the following, each enclosed in curly braces:
Example Method Query:
{MyWorkflowProfileName}{Actual}{2015M1}{AllProfiles}{Descendants}{Empty String or Filter Expression}WorkflowProfileandDescendantEntities
The WorkflowProfileandDescendantEntities method creates a list of Entities and all descendants located under Entity Assignment for this Workflow Profile. Parameters should include the following, each enclosed in curly braces:
WorkflowProfileEntities
The WorkflowProfileEntities method creates a list of Entities located under Entity Assignment for this Workflow Profile. Parameters should include the following, each enclosed in curly braces:
WorkflowProfileRelatives
The WorkflowProfileRelatives method lists related Workflow Profiles based on certain criteria. Parameters should include the following, each enclosed in curly braces:
Example Method Query:
{GolfStream}{Actual}{2011M1}{AllProfiles}{Descendants}{true}{}{MyWorkflowProfileName}{Actual}{2015M1}{AllProfiles}{Descendants}{true}{Empty String or Filter Expression}WorkflowProfiles
The WorkflowProfiles method lists the Workflow Profiles. Parameters should include the following, each enclosed in curly braces:
Example Method Query:
{AllProfiles}{Type = 'InputAdjChild'}.WorkflowStatus
The WorkflowStatus method lists the status, lock status and last step completed of a given Workflow Unit. Parameters should include the following, each enclosed in curly braces:
Example Method Query:
{Houston}{Actual}{2011M1}{AllProfiles}{Descendants}{}{MyWorkflowProfileName}{Actual}{2015M1}{AllProfiles}{Descendants}{Empty String or Filter Expression}WorkflowStatusTwelvePeriod
This returns status value and text summary for 12 months for a given Workflow Profile, Scenario and Year. Parameters should include the following, each enclosed in curly braces:
Example Method Query:
{MyWorkflowProfileName}{Actual}{2011}{AllProfiles}{Descendants}{Empty String or Filter Expression}Method Query Parameter Options
Parameters should include the following, each enclosed in curly braces:
SQL Command Type
A SQL query against either the Application or Framework database can be written as a Data Source. Reference substitution variables such as |WFProfile| from within the SQL statement.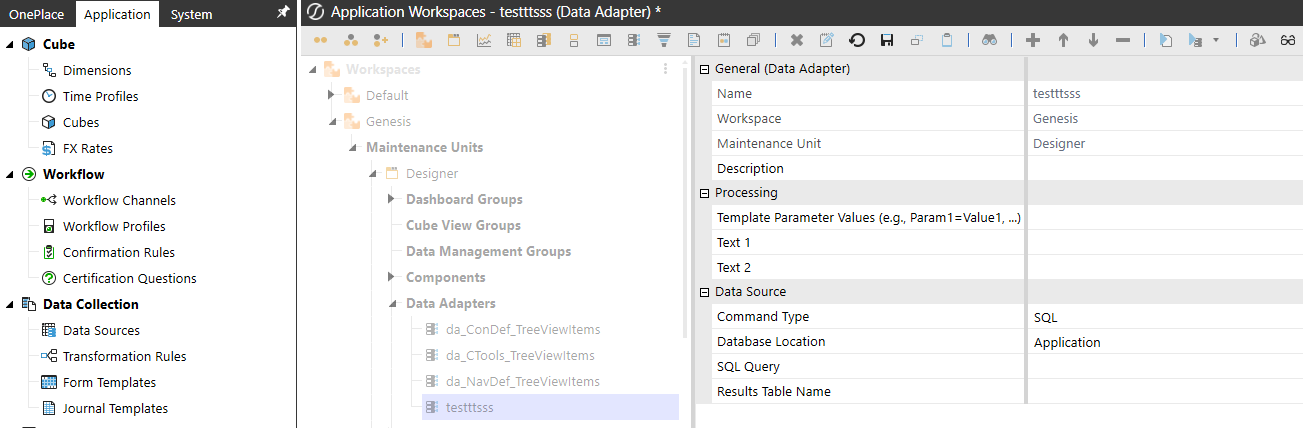
-
Database Location: Select Application, Framework or External data source.
-
Application: The current OneStream Application database where Stage and financial Cube data resides.
-
Framework: The connected OneStream Framework database where security and log data resides.
-
External: Any other database outside of OneStream.
-
External Database Connection: If External is the chosen Database Location, select the External Database Connection name here. This list is defined in the OneStream Server Configuration Utility.
-
-
-
SQL Query: The SQL statement ran for this Data Adapter.
-
Results Table List: This specifies the name of the resulting table generated when the Data Adapter is run, otherwise it will default with a name of Table.
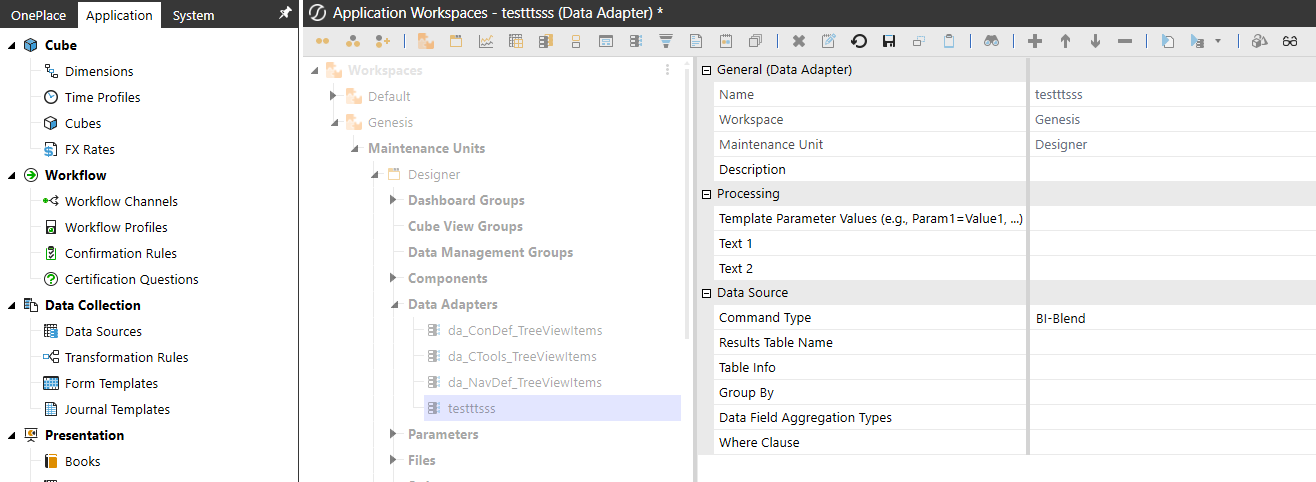
BI Blend Command Type
The purpose of the BI Blend Adapter is to provide dashboard designers with a pre-defined interface to querying BI Blend tables. The data sourced by the BI Blend Adapter can be used to design standard OneStream dashboard.
The BI Blend Workflow process is designed to generate large external database tables formatted in a column store index optimized for analytic reporting. The overall number of records that may be generated by the BI Blend process may be too large for the Dashboard components to process. Therefore, the designer should manage the returned dataset by defining an appropriate Where Clause to retrieve a “slice” of the BI Blend table which is suitable for the BI Blend Adapter.
-
Results Table Name: Define a table name to store the content of the BI Blend adapter query.
-
Table Info: This defines the name of the BI Blend table name to be queried. This label supports the use of Parameters and Substitution Variables.
-
Group By: This defines the source database columns, and their order, which are to be returned to the adapter. These labels must match the names specified on the database. Any field to be pivoted must be in the Group by list.
-
Data Field Aggregation Types: The Data Field Aggregation Type is used to identify which database column should be used as the Measure field. The adapter can support multiple database columns as Measures. Each defined measure can be defined to derive the results as a different Aggregation Type. Parameters and/or Substitution Variables are supported.
-
Sum
-
Min
-
Max
-
Avg
-
Count
The syntax required is to define each Aggregation Type result as a unique key. AggregationType = [databaseColumnName, Type]
-
AggType1 = [2018M1, Count], AggType2 = [2018M1, Sum]
-
AggType1 = [|WFYear|M1, Count]
-
-
Where Clause: The is used to “pre-filter” the table. The BI Blend Adapter will query the source table and return all the results to the client for processing, such as for use in a Pivot Grid. The size of the query must be managed to ensure the overall performance of the Dashboard report is optimized. The Where Clause uses standard SQL syntax to define the filters which are applied to the query.
-
DatabaseColumn = ‘Text’
-
DatabaseColumn Like ‘2019%’ - As all columns beginning with 2019
-
DatabaseColumn1 = ‘CostCenter’ And DatabaseColumn2 = ‘Midwest’
-
Direct Load Reporting Data Adapter Method Types
Dashboard reporting against Direct Load Workflow activity is simplified with specialty Data Adapter Methods.
-
Direct Load Info: Retrieves results from the StageDirectLoadInformation table.
Example Method Query:
{Workflow Profile Name}{Scenario Name}{Time Name}{Filter} -
Stage Summary Target Data: Query designed to automatically determine the method used to manage Summary Target Data, as Row or Blob, and appropriately return the results.
Example Method Query:
{Workflow Profile Name}{Scenario Name}{Time Name}{Filter}


